
Data at every second is expanding at a rapid pace, in fact, going by the new research, amount of new information generated per second is predicted to reach a number of 1.7MB by 2020. With businesses and users generating such a huge amount of data every day, you need to effectively utilise every piece of information for your business.
Data analytics is one such industry where every tiny bit of information plays a crucial role in determining the business’s decision-making strategies. Business owners are now becoming more aware of its power; thus, more and more businesses have started imbibing data analytics into their regular functioning.
Contact centres collect an overwhelming number of unstructured data every second, and so the importance of adapting data analytics is far more peculiar than other business sectors. In the past, contact centres have used offline parameters outlining general metrics to evaluate their process and agent’s performance. However, the need of the hour lies in switching to data analytics and making smart decisions. Many cloud contact centre software have already adopted this approach, and others are in progress.
Let’s see how cloud contact centre can exploit data analytics advantages in its favour:
Monitor Call Activity
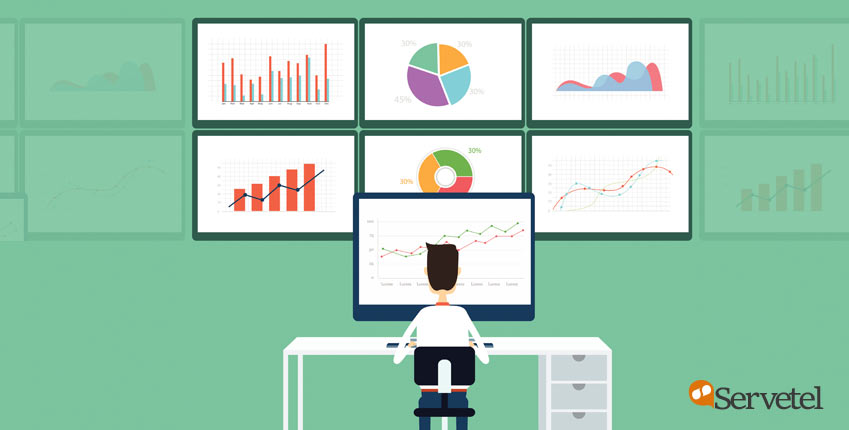
Call Analysis Dashboard is a convenient interface to assist a manager in the quick monitoring of activities in one go. It has equipped the managers with round the clock monitoring facility which is accessible through any device at any time.
With this dashboard, a manager can supervise all the critical components of the contact centre. On Servetel’s dashboard, users can view components such as number of active, missed, answered, on-hold, queued, and hung up calls. This largely helps in predicting any business crisis and arms the business with mitigation strategies beforehand.
Moreover, one can also view additional details such as customer name, number, agent name, and the total call time on the dashboard to get advanced analysis.
Assist Agents with Call Whispering/Call Barging
One of the most beneficial feature for an agent as well as a manager is the call whispering feature. If a manager wants to assist the agent with calls or silently listen to the call without affecting the conversation, they can opt for call whisper/barge feature present on the call dashboard.
This feature on the dashboard not only helps the agent and the manager but also the customer in getting the best possible solution for their queries.
Keep a check on agent’s productivity
Apart from calls, one major concern which gets resolved through dashboard analysis is monitoring your agent’s productivity. Through the dashboard, you have an in-depth analysis of the agent’s productivity by the following parameters:
- Average Call Handling Time – It is an average of the total time which an agent spends with the caller until the issue gets resolved. It generally includes parameters such as — hold time, talk time, and other in between tasks.
- Call Response Time: It is the time taken by an agent to answer the incoming call which is used to study every agent’s responsiveness throughout the day.
- Lead Conversion Rate: This metric help in calculating your conversion rate of leads into customers.
- Calls per Hour/Day: This metric help you understand your high-performing and low performing agents by studying the no. of call they attend every hour/day.
- Customer Satisfaction Scale: It is the most crucial parameter where every customer rates the call based on the quality of query resolution received.
- Average On-Hold Time: As customer queries vary so do their resolution. This metric tracks the time agent puts the caller on hold to resolve their queries.
- Break Time per Agent: This metric determines the break time for every agent, which is also an essential factor in assessing agent’s productivity.
- Call Abandonment Rate: Not every inbound call gets answered, so this metrics helps to understand the number of unanswered calls along with their frequency.
- Agents Absenteeism: Are your agents following their scheduled shifts, or there is a time lag which is causing you to lose customer calls? This tracking is done by tracking attendance of the agents by studying the time difference between two agent’s check-in, check-out.
Handling a large group of agents is a challenging task, and the above parameters make monitoring a less burdensome process. The seamless user interface of dashboards fosters quick analysis of data.
Customer Satisfaction
Every analysis in the business boils down to how happy your customers are. Once foundational processes get laid down, the next important analysis is customer satisfaction metric. This data gets analysed on many factors such as customer feedbacks, call resolution, call time, agent’s conversation, and no. of outgoing and incoming calls.
One major analysis which helps in mitigating upcoming customer issues is— dividing the queries into multiple categories and creating a blueprint to solve the troubled part of your businesses beforehand.
Understanding Trends
A group of Northeastern University Network scientists found that 93 percent of human behaviour is predictable. Thus, understanding behaviour patterns gives business a peek into customers’ mindset and their ever-changing needs.
Inclusive dashboards allow business to comprehend the agents/call information smoothly. These numbers can be studied in numerous ways depending upon kind of business information you want to extract. Below are few of the many trends which are analysed through contact centre data:
- Busiest Time of Day
- Common Issues Encountered by Most Customers
- Issues Raised due to Technological Glitches
- Most Idle Time of the Day
- Most Productive Time of the Days
Conclusion
As the famous saying goes,
“If you can’t measure it, you can’t improve it.”
To improve your business processes constantly, you need to understand your ongoing processes in quantifiable context. Moreover, it also gives a strong base to your decisions as they are now built on realistic data patterns.
So, if you are growth-oriented contact centre manager, look out for a cloud telephony service provider such as Servetel— who can help your business grow by providing wide-range of solutions with powerful reporting and analytics. Contact us today at 1800-120-4132.